Easier React Native (Android) Debugging
For this Android on Windows hobbyist, React Native remains an alluring but elusive shiny new toy to play with.
That's simply because creator Facebook has an iOS-first approach:
As React Native on iOS requires a Mac and most of the engineers at Facebook and contributors use Macs, support for OS X is a top priority. However, we would like to support developers using Linux and Windows too. We believe we'll get the best Linux and Windows support from people using these operating systems on a daily basis.
Therefore, Linux and Windows support for the development environment is an ongoing community responsibility.
They go on to say, "As of version 0.14 Android development with React Native is mostly possible on Linux and Windows."
Android/Windows 'Mostly Possible'
Just about a year after React Native was open sourced, "mostly possible" is close enough, I guess, as there's no guarantee the community can ever match core Facebook engineers' efforts on the iOS side.
And those efforts have certainly paid off. In last week's one-year review of the wildly popular project (30,000-plus stars on GitHub), Facebook's React Native team -- which has basically doubled in size to about 20 engineers -- explained how the year's effort has been "an epic ride."
So, after boning up on the basic React.js Web technology from which React Native was born, I did some basic tutorials. One thing I noticed on the Facebook site is that debugging information is a little sketchy, especially on the Android side. In the React Native docs, most of the debugging guidance consists of skimpy details about "Android logging" and using Chrome Developer Tools.
Too Many Moving Parts, Glitches
Following the provided Rotten Tomatoes movie
tutorial, I ended up with a code editor opened up, along with one Command Prompt terminal window open to start the JavaScript packager, another Command Prompt opened to kick the debugging project off with a "react-native run-android" command, an emulator (I used Genymotion) or a device, and then a browser window opened up to localhost to debug the app using Chrome DevTools. That seemed like a lot of moving parts, entailing a lot of jumping around from window to another.
Also, perhaps because of my inexperience in using the DevTools, I ran into several glitches. Sometimes variables couldn't be evaluated at a breakpoint, though they were certainly in scope.
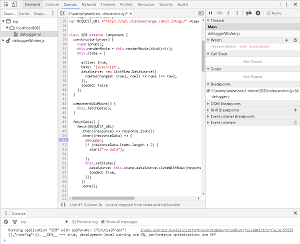 [Click on image for larger view.]
Variable '' in Chrome DevTools (source: David Ramel)
[Click on image for larger view.]
Variable '' in Chrome DevTools (source: David Ramel)
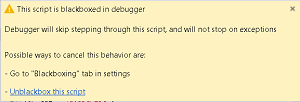
I tried "evaluate in console" on a variable and got an Uncaught ReferenceError ... variable "not defined" message, only to have it kick in moments later, for some reason (not sure what I clicked). I got a "This script is blackboxed in debugger" message in trying to set a breakpoint, which is apparently problematic to others, too. The iOS-first guidance (with repeated directions to use the Mac Command button, for example), didn't help, either.
 [Click on image for larger view.]
The 'Blackboxed" Error Message (source: David Ramel)
[Click on image for larger view.]
The 'Blackboxed" Error Message (source: David Ramel)
I figured there had to be a better way, using one IDE or code editor to simplify things.
Looking to Quora for Editor Advice
Poking around the Web, I found a Quora
question about the best editor with which to write React and React Native code. A prominent answerer pointed out Atom, Nuclide and the newcomer, Visual Studio Code.
"
Nuclide is Atom enhanced by Facebook for React development," the answer stated. But it doesn't play nice with
Windows: "There are two supported platforms for Nuclide, Linux and Mac OS X. Nuclide can be installed on Windows, but it is not fully supported. ... Some features of Nuclide may work on Windows, but the full Nuclide experience is not yet supported."
Worse yet: "Debugging React Native for Android is currently not supported except for the simulator logs."
That rules out Nuclide, though I had installed it earlier and again played around with it a bit just to prove it indeed wouldn't debug an Android app.
I uninstalled Nuclide, to try just
Atom with a
React.js package, for JSX support, which I had played around with earlier. I ended up wasting a lot of time just getting a project directory tree view to show up, again, apparently a
known issue.
I also didn't have access to the React Native commands from the Command Palette, to start the packager, debugger, etc. So I would have to have the terminal windows open again.
Visual Studio Code 'Just Works'
So it was on to
Visual Studio Code.
Guess what? It just worked!
Having just hit version 1.0, Visual Studio Code is Microsoft's lightweight, free, open source, cross-platform little brother to the outstanding Visual Studio IDE. It, too, has Atom connections, being based on Electron, which used to be called Atom Shell, a part of the Electron project.
Even better, it can leverage the outstanding React Native Tools extension. "This extension provides a development environment for React Native projects," the project says. "You can debug your code, quickly run react-native commands from the command palette and use IntelliSense to browse objects, functions and parameters for React Native APIs."
It's all true. I just hit Ctrl+Shift+P to open up the Command Palette, wherein I could start the packager (React Native: Start Packager) and kick of the project (React Native: Run Android). No more multiple Command Prompt windows. Breakpoints were set with single-click ease, unlike my experience with Chrome DevTools. Single clicks also let you choose your debug environment and your target (iOS or Android). Then a single click of the Start button and it fired up the packager and launched the debugger all in one motion. And it worked flawlessly with the Genymotion simulator. And the directory tree view just shows up.
A Couple Glitches
I did run into some minor glitches. Again, these probably stemmed from inexperience with the tool, but I'll detail them here in case somebody with the same programming aptitude I have is Web searching about the same issues.
In some Visual Studio Blog documentation, it says to hit Ctrl+P to invoke the Command Palette to install the React Native Tools extension.
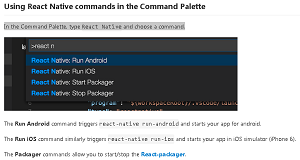
Which is fine, but in some React Native Tools guidance, it says, in the Command Palette, to type "React Native" to choose a command from the drop-down list that appears, to Start Packager or Run Android, for example. I tried that and saw no commands. Finally I noticed that the screenshot shows a ">" character before the example command.
 [Click on image for larger view.]
The VS Code Command Palette (source: David Ramel)
[Click on image for larger view.]
The VS Code Command Palette (source: David Ramel)
I thought that ">" symbol just indicated a prompt, but it actually shows up when you open up the real Command Palette with Ctrl+Shift+P. That's opposed to the aforementioned guidance that said to open the Command Palette with Ctrl+P. It turns out that Ctrl+P command is actually a "Quick Open" command, to bring up a prompt to open a file or symbol or do myriad other things. To run a command, you have to type the ">" character first after opening up the Ctrl+P prompt, and then you can run the React Native commands (or just open up the "real" prompt that shows the ">" symbol with Ctrl+Shift+P). A small thing, but it caused me some confusion.
I experienced another issue with debugging. Upon pressing Start to launch a debugging session on the emulator, I found the session wasn't stopping on the breakpoints I had set. The VS Code documentation says this will happen if the JavaScript packager is started outside the VS Code environment (as in a Command Prompt window), but that wasn't the case here.
Select 'Debug with Chrome' to Debug with VS Code
Mystified, I fooled around with various things trying to get it to work. From the emulator, I finally hit the Menu button to bring up developer options and selected "Debug with Chrome" to see if that would bring up a localhost browser or what. To my surprise, the debugging in VS Code kicked in -- the session stopped at the breakpoints, and variables could be inspected in a variable window, a watch window or by hovering over the variable name. Everything worked.
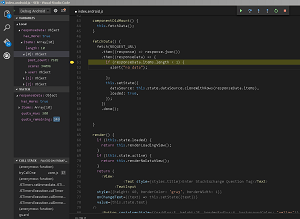 [Click on image for larger view.]
Inspecting Variables in VS Code (source: David Ramel)
[Click on image for larger view.]
Inspecting Variables in VS Code (source: David Ramel)
Ironically, I found an explanation for this behavior in guidance for Nuclide. "From the simulator, you will want to enable debugging the application. Press cmd-D (ctrl-D on Linux)," it says. "This will bring up the debug options for your application. Choose Debug in Chrome." It continues: "Debug in Chrome in this case is a bit of a misnomer since you will actually be debugging through the Nuclide debugger (based on Chrome Dev Tools)."
So that was it. You click on "Debug in Chrome" from the simulator to actually "Debug in VS Code." Go figure.
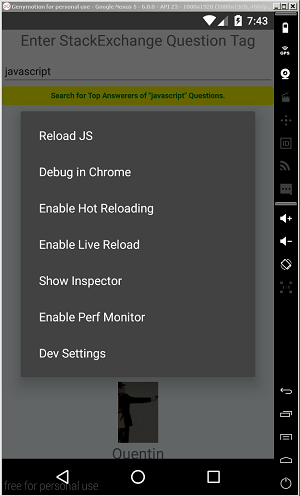 [Click on image for larger view.]
Developer Options in the Genymotion Emulator (source: David Ramel)
[Click on image for larger view.]
Developer Options in the Genymotion Emulator (source: David Ramel)
With those minor glitches overcome, the debugging experience with my sample Android app from within VS Code worked fine. Sure, Android/Windows support in React Native is lagging behind iOS and might be forever, but it can be done.
"In the year since the iOS launch, there have been quite a few apps released to the App Store, and high-quality Android apps are starting to appear too," Facebook affirmed in its one-year review.
Community Moves Project Forward
Facebook credited community involvement with helping to move the React Native project forward. "The adoption of React Native and its developer community have both grown much faster than we had expected," the team said. "Over 650 people have committed code to the React Native codebase. Out of the 5,800 commits to the codebase, 30 percent were made by contributors who don't work at Facebook. In February 2016, for the first time, more than 50 percent of the commits came from external contributors. With so many people from the community contributing to React Native, we've seen as many as 266 new pull requests per month (up to 10 pull requests per day). Many of these are high-quality and implement widely used features."
If I continue to learn in my blundering, hobbyist manner, maybe I can eventually contribute to some code documentation fixes or something to help the cause. In the meantime, I encourage those more proficient to contribute on the Windows/Android side of things. It definitely needs the help.
And I'm not alone in that opinion. Some recent commenters on Hacker News agreed with me, with thoughts such as: "It seems that React native on iOS is more stable than it is on Android. I wouldn't use it in production for Android"; and "When trying it for Android it didn't feel like a help at all. I still had to set up all this mobile dev environment boilerplate...."
And the No. 1 feature request on the ProductPains site for soliciting feedback reads: "Get Android to feature parity with iOS."
"Developing an app with React Native on iOS is a very good experience," the ProductPains post reads. "On Android (which I understand is still very new), everything feels a little more complicated and I find myself writing a lot more native code than I would like." So here's hoping for a little Android catch-up.
Have you tried creating Android apps on Windows with React Native? Please comment here or drop me a line.
Posted by David Ramel on April 18, 2016