News
Microsoft Open Sources Java Debugger for Visual Studio Code Editor
- By David Ramel
- October 25, 2017
Microsoft open sourced a Java debugger it developed for the lightweight, open source Visual Studio Code editor.
About a month ago, the company released the VS Code extension to provide Java debugging, publishing it in the Visual Studio Code Marketplace and promising that it would soon be released to the community. This week, Microsoft said the tool was such a big hit that it's been improved and open sourced, as promised.
With no native support for Java -- always near the top of popularity charts -- VS Code developers have been using third-party tools such as the Language Support for Java by Red Hat, which has been downloaded more than 1 million times.
While noting the one-year anniversary of the tool (still in preview), Red Hat last month mentioned an upcoming debugger "from our friends" who turned out to be Microsoft, which announced Java Debugger for Visual Studio Code a day later.
This week, while noting the move to open source, Microsoft also announced the open sourcing of the Java Debug Server that provides support on the back-end.
"Since we first released our Java Debugger extension for Visual Studio Code on Sept. 28, it quickly became the most trending extension of the month," said Xiaokai He, program manager, Java Tools and Services, in a blog post. "And of course, lots of feedback and suggestions were submitted from our active developer community. You shared, we listened."
The two main improvements to the debugger mentioned by He are automatic resolution of a project's main class, so developers don't have to explicitly specify it anymore, and fully supported external source files. Speaking of the latter, He said, "With this feature, you can now also debug with third-party classes, when the source code is inside a JAR or a source attachment. And you can also set breakpoint in those classes ahead of debugging."
Other changes include:
- Adoption of the new Visual Studio Code Debug protocol.
- The tool displays stackframe name with format ClassName.MethodName(ParameterList).
- Improvements in the call stack display info for files without sources.
- Bug fixes.
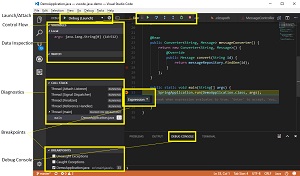 [Click on image for larger view.] Using the VS Code Java Debugger (source: Microsoft).
The new functionality builds upon the existing capabilities of the debugger previously detailed by Microsoft, including:
- Launch/Attach -- You can either launch the Java project within VS Code or attach to any running JVM process in debug mode, locally or remotely.
- Breakpoints -- Conditional breakpoints by Expressions and Hit are supported and can easily be set using the inline breakpoint settings window. This allows you to conveniently add conditional breakpoints to your code, directly in the source viewer, without requiring a modal window. Break on exceptions is also supported.
- Control flow -- Including Pause, Continue F5, Step over F10, Step into F11, Step out Shift+F11.
- Data inspection -- When you're stopped at a breakpoint, the debugger has access to the variable names and values that are currently stored in memory. Inspect/Watch/Set Variables are supported.
- Diagnostics -- The CALL STACK panel shows the call stack of your program and allows you to navigate through the call path of each captured allocation. Multi-threaded debugging is supported by parallel stacks.
- Debug Console -- The Debug Console lets you see information from both stdout and stderr.
The source code for the debugger is now on GitHub, where the brand-new project has 22 stars, eight contributors, two releases and four forks.
On the Visual Studio Code Marketplace, the extension has been installed more than 56,000 times, receiving a perfect 5.0 rating from seven developers.
About the Author
David Ramel is an editor and writer at Converge 360.