News
DevOps Analytics Tool Offered by Big Data Specialist
- By David Ramel
- June 20, 2016
Perspica Inc. is using machine learning (ML) in its new DevOps analytics tool designed to help enterprises measure the impact of new software releases on operations.
The company, which specializes in the real-time analysis of Big Data, has integrated popular DevOps stacks into the engine powering its analytics platform in order to address operational downtime risks. The company leverages ML to analyze what it refers to as the "fab five" analytics engines: topology, behavior, anomaly, problem and predictive.
The company's platform features Incident Replay, which it describes as "a time machine for all your data" that provides visualization of an application stack's layers in one place, revealing performance data, logs and topology. "Incident Replay allows you to identify the root cause of an outage or performance degradation at any point in time," says the company's Web site for the technology, which is now being brought to bear on DevOps.
"Until now, developers, site reliability engineers and DevOps engineers have had little visibility into the operational impact of continuous delivery," the company said in announcing the DevOps functionality. "Today, Perspica announced it has integrated major DevOps stacks into its analytics engine to minimize the operational risk of downtime."
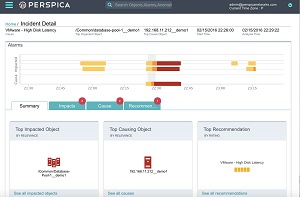 [Click on image for larger view.]
Using Incident Replay (source: Perspica)
[Click on image for larger view.]
Using Incident Replay (source: Perspica)
The company listed the following features of its new initiative:
-
Analytics for the entire stack -- In addition to the traditional monitoring tools that DevOps teams are using, Perspica provides troubleshooting, diagnosis, root cause analysis and predictive analytics for the entire application infrastructure stack.
- DevOps integrations -- Perspica now supports major DevOps platforms including Docker, Flume, OpenTSDB, Redis, Zookeeper, Kafka, Collectd, MongoDB and Loggly.
- Time machine -- Perspica's Incident Replay is a time machine for performance data, logs and topology. It provides DevOps personnel with the ability to play back the impact of the latest code release on application behavior and identify the root cause of any application performance degradation.
- Visualization capabilities -- Customers can now visualize together performance data, topology change and logs in a single pane for a current or past time period. Users can drill down into issues to keep applications up and running, as well as prevent and minimize the impact of outages and quickly fix incidents when they do occur.
"The continuous delivery model means developers have to move quickly, and they are hampered because they often can't see how the new software release is affecting operations," said CEO Dan Maloney in a statement last week. "This can lead to application performance issues and even outages. Incident Replay overcomes that issue. We're excited to offer these capabilities to empower the DevOps community with critical insight and end-to-end visibility into the entire development stack."
About the Author
David Ramel is an editor and writer at Converge 360.