Data Visualization Shows JavaScript Is Tops on GitHub
One of the coolest data visualizations I've seen in a while shows JavaScript rules the repository roost on GitHub, by a pretty big margin.
GitHut is "a small place to discover languages on GitHub," but it supplies a large amount of information, measuring active repositories, total pushes, pushes per repository, new forks per repository, opened issues per repository, new watchers per repository, the year the language appeared and much more. It hooks into the public GitHub API to grab data from the universe of some 3.4 million users and 16.7 million repositories on the GitHub Archive.
Hovering over an item in any of the columns brings up lines that show that item's ranking in every other column, with all kinds of data points showing up as you move around. Comments today on Hacker News refer to it as a "parallel lines chart" or "hammock chart" or perhaps even some new type of graph not yet named. The GitHut site says: "The visualization is based on two type of visualization, a Parallel Coordinates chart and a Small Multiples visualization."
Those visualizations help you instantly discover interesting information. For example, hovering over new darling language R (big in statistics and Big Data) shows it coming in as No. 12 in the Active Repositories ranking, but way down toward the bottom in Pushes Per Repository and yet No. 1 in New Forks Per Repository.
What does that mean?
It's hard to tell without some context, as several Hacker News commenters said. But it sure is fun to play around with.
One thing for sure, on GitHub, it's JavaScript, stupid.
It had 323,938 Active Repositories, compared to No. 2 Java at 222,852. Here's the top 10:
| Language |
Active Repositories |
| JavaScript |
323,938 |
| Java |
222,852 |
| Python |
164,852 |
| CSS |
164,585 |
| PHP |
138,771 |
| Ruby |
132,848 |
| C++ |
86,505 |
| C |
73,075 |
| Shell |
65,670 |
| C# |
56,062 |
The info basically reflects that from several other programming language popularity indexes, where Java is usually right at or near the top. For example, it's now No. 1 on the PYPL PopularitY of Programming Language index for February 2015; No. 2 on the RedMonk Programming Language Rankings for January 2015; and No. 2 on the TIOBE Index for February 2015.
JavaScript, however, only cracks the top five on the RedMonk list, where it's No. 1 (though JavaScript was named "language of the year" for 2014 by the TIOBE index for its growth).
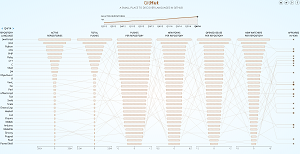 [Click on image for larger view.]
The GitHut programming language popularity data visualization site.
[Click on image for larger view.]
The GitHut programming language popularity data visualization site.
(source: GitHut)
The GitHut tool also shows top active languages in a series of line charts with data from the second quarter of 2012 to the fourth quarter of 2014. Nothing much jumps out except for a dramatic downturn in the "view by percentage total" option for the Ruby language.
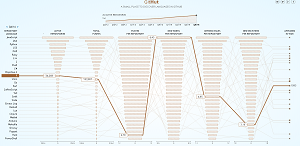 [Click on image for larger view.]
Highlighting the R language.
[Click on image for larger view.]
Highlighting the R language.
(source: GitHut)
"This confirmed some of my suspicions," a Hacker News commenter said. "Ruby seems to be in decline, just like Perl, but not declared dead yet." But again, the data could be misleading without context. For example, one commenter noted that while percentage ranking declined for Ruby, the total number of repositories increased. That led to speculation that the percentage decline happened because Ruby was so popular with the original GitHub user base (the Rails community was a big early user) but its percentage of use has declined as more organizations joined the GitHub community.
So whether GitHut is "data porn" (flashy visualization with no analysis) as opined by one commenter or "an 'AHA' piece of statistics," in the view of another, the site is definitely worth checking out.
The actual usefulness is up for debate. "I feel this graph gives an idea of what the tendencies for a language is, and then you can research the context," one Hacker News commenter said. "You can glimpse a lot of fun things from this graph."
Here's the info straight from the GitHut site ("Carlo Zapponi 2014" is listed at the bottom):
GitHut is an attempt to visualize and explore the complexity of the universe of programming languages used across the repositories hosted on GitHub.
Programming languages are not simply the tool developers use to create programs or express algorithms but also instruments to code and decode creativity. By observing the history of languages we can enjoy the quest of human kind for a better way to solve problems, to facilitate collaboration between people and to reuse the effort of others.
GitHub is the largest code host in the world, with 3.4 million users. It's the place where the open-source development community offers access to most of its projects. By analyzing how languages are used in GitHub it is possible to understand the popularity of programming languages among developers and also to discover the unique characteristics of each language.
What did you get out of this data visualization? Know any others related to programming languages? Please comment here or drop me a line.
Posted by David Ramel on February 11, 2015