Stack Overflow Data: React on the Rise, More Devs Self Taught, Rust Most Loved
Stack Overflow is out with the big daddy of all developer surveys, polling more than 56,000 coders around the world, who are increasingly self taught, embracing React in a big way and in love with the Rust programming language.
At least those are a few of the standout findings among survey results that are mostly the same as the previous year: JavaScript rules everything; Notepad++ is the most popular dev environment/text editor; Windows is the most popular desktop OS; and so on. This is at least the fourth year in a row that the popular developer-oriented Q&A site has published survey results culled from its millions of users.
What's strikingly new in this year's survey is the rise of React, the revolutionary Web tech introduced by Facebook that was last year modified for native mobile app development. While it's young and evolving on the native front, React is taking the Web dev world by storm.
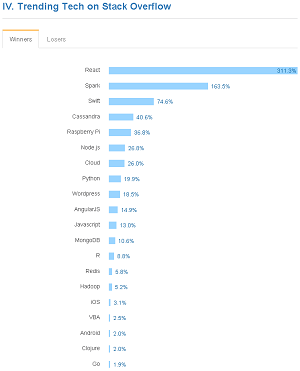
React figured little if at all in last year's survey, but it's all over the new one. In fact, it was No. 1 among responses in the "Trending Tech on Stack Overflow" section, registering an astounding 311 percent increase, well above No. 2 Apache Spark at 164 percent. (Since I couldn't find any mention of it at all in last year's survey, I'm not sure where the 311 percent figure comes from). Note that I'm rounding off the percentages.
 [Click on image for larger view.]
Trending Tech Winners (source: Stack Overflow)
[Click on image for larger view.]
Trending Tech Winners (source: Stack Overflow)
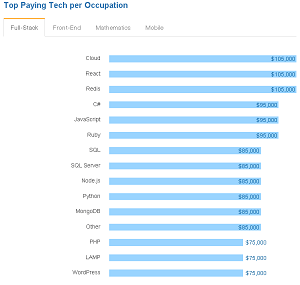
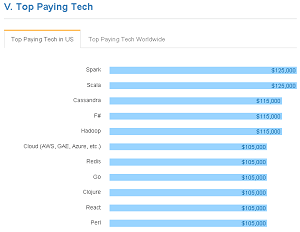
In the rankings of the top paying tech per occupation, React was tied for No. 1 among full-stack developers, with cloud and Redis, all pegged at $105,000. That salary put it in a tie for third place among "Top Paying Tech in U.S.," along with five other technologies.
"Newer Web-development technologies like React, Node.js and AngularJS are growing in use," the survey report noted.
It continued: "Full-stack developers who know JavaScript and develop for the cloud, or work with React or Redis are paid better than their peers. Front-end developers who know JavaScript and React, Node, or Angular get paid more than other front-end developers."
 [Click on image for larger view.]
Top Paying Tech Among Full-Stack Developers (source: Stack Overflow)
[Click on image for larger view.]
Top Paying Tech Among Full-Stack Developers (source: Stack Overflow)
In the "Most Loved" category, React ranked No. 7. That question was one that saw a change from last year, with the Rust programming language taking over the No. 1 spot from last year's darling: Swift. Last year, Rust was No. 3, behind C++ 11. This year, F# took over third place behind No. 2 Swift.
Another notable change in results from last year concerned education, with far more respondents reporting being self taught, rather than having learned their craft through formal education. In the 2016 survey, 69 percent of respondents said they had taught themselves to some degree, a significant increase from last year's 42 percent.
 [Click on image for larger view.]
Top Paying Tech in the U.S. (source: Stack Overflow)
[Click on image for larger view.]
Top Paying Tech in the U.S. (source: Stack Overflow)
"69 percent of all developers tell us they are at least partly self-taught. (13 percent of respondents across the globe tell us they are only self-taught.)," the report stated. "43 percent of developers have either a BA or BS in computer science or a related field. 2 percent of developers have a PhD."
(If nothing else, the survey taught me that some institutions of higher learning offer bachelor of arts degrees for computer science. Who knew? Are there bachelor of science degrees for fine arts?)
Other survey highlights include:
- The "Most Dreaded" technology (percent of developers who are developing with the language or tech but have not expressed interest in continuing to do so) was Visual Basic (80 percent), followed by WordPress (74 percent), and Matlab (73 percent). Last year, Salesforce was No. 1.
- The "Most Wanted" tech (not developing with the language or tech but have expressed interest in doing so) was Android (16 percent), followed by Node.js (15 percent) and AngularJS (13 percent). Android was also No. 1 last year.
- JavaScript was the most popular technology (55 percent). Just like last year. And the year before that. And the year before that. And probably next year. And the year after that.... That category was rounded out by the usual players: SQL, Java, C++, PHP and so on. Interestingly, while Objective-C has been No. 10 for the past three years, the young Swift language has yet to crack the top 10, despite receiving huge amounts of publicity and being open sourced by Apple last year.
- Notepad++ was the most popular text editor (35 percent), followed by Sublime Text (25 percent) and Vim (15 percent).
- The average developer respondent is 29.6 years old. The median is 27.
- The average developer has about 6.5 years IT or programming experience.
- Younger devs much prefer Star Wars over Star Trek. Older people (like me), much prefer Star Trek. Firefly is the top write-in, followed by Stargate, Doctor Who and Babylon 5.
- 93 percent of developers reported being male.
- The biggest loser in the "Trending Tech on Stack Overflow" (change in share of Stack Overflow votes) was, unsurprisingly, Windows Phone (65 percent), followed by Haskell (40 percent) and CoffeeScript (38 percent).
- The top paying tech worldwide (developer salaries as a percent of the average developer salary in a respondent's country) was F#, barely edging out Dart and Cassandra and Spark. In the U.S., the order is: Spark, Scala and Cassandra. (See more on Cassandra here).
- Top challenges at work include unrealistic expectations (35 percent), poor documentation (35 percent) and unspecific requirements (34 percent). That roughly correlates with other surveys like this one.
- For the first time, more developers are using Mac than Linux as their primary OS.
- Only 7 percent of developers identify as "rock stars."
- Most developers prefer dogs to cats. (But not developers in Germany.)
Unlike last year's survey, the 2016 edition contained no information about the amount of caffeinated beverages consumed or whether developers preferred tabs or spaces for source code indentation.
The survey was mainly based on 56,033 developers who answered questions on Stack Overflow, coming from 173 countries, who were asked 45 questions.
"Surveys aren't perfect," Stack Overflow said. "While our large sample size helps offset some biases, it's still biased against devs who don't speak English, or who don't like taking English-language surveys. In some sections we've augmented the results with insights gleaned from the activity of Stack Overflow's 40 million monthly visitors."
Stack Overflow also announced it has published a "2016 Developer Hiring Landscape" based on the survey data that's available for free download upon providing registration information. It's targeted at employers and recruiters looking to hire developers. According to that survey, "62 percent of developers don't currently have their dream jobs. Only 36 percent are currently in a job they love." Thus, the company says, "75 percent of developers are open to new job opportunities, even if they aren't actively looking right now."
Posted by David Ramel on March 17, 2016