News
2 Reports Investigate Growing Demand for Enterprise Mobile Apps
- By David Ramel
- March 21, 2017
Two new research reports from different companies with different goals speak to one main conclusion: enterprises are demanding more mobile apps.
Who develops them, how they're created and what they're used for may vary, but more enterprise mobile apps are definitely being built, according to reports from Fliplet and ContractIQ. Fliplet provides a Web-based low-code tool of the same name, while ContractIQ, specializing in "outsourced app development," lets contract development agencies show off their work and get matched up with employers.
Fliplet conducted research based on the usage of its low-code dev tool to come up with the new "2017 Enterprise Mobile App Report," seeking to answer the question: "If cost or technical limitations weren't a problem, what apps would companies build?"
ContractIQ polled the 4,000-plus app development agencies in its network to publish its Annual Mobile App Development Report 2017 to answer the question: "What's happening in the mobile development economy?"
"Businesses are creating more apps than ever before," is the first data point observation of the Fliplet report, which indicates that enterprises created an average of 10.6 apps in 2016, up from 4.7 in 2015, 1.7 in 2014 and just 1 in the inaugural year of the report, 2013.
 [Click on image for larger view.]
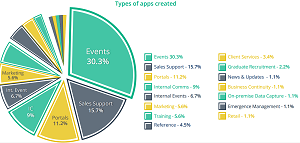
Types of Enterprise Apps (source: Fliplet)
[Click on image for larger view.]
Types of Enterprise Apps (source: Fliplet)
The report stated: "Organizations are realizing the importance and potential of enterprise apps. It's not difficult to see why when you consider:
- Companies gain an extra 240 hours of work per year from employees when using enterprise mobile apps.
- 71 percent of employees spend over two hours a week accessing company information on mobile devices.
The company also cited Adobe research that indicated: "61 percent of organizations believe that if a company hasn't deployed any enterprise mobile apps yet they're at a competitive disadvantage."
 [Click on image for larger view.]
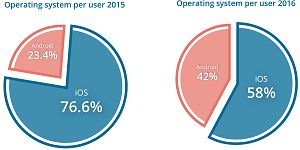
Android vs. iOS (source: Fliplet)
[Click on image for larger view.]
Android vs. iOS (source: Fliplet)
Some other data tidbits in the Fliplet report include:
- In 2015, 78 percent of app users accessed their app through iOS devices, but in 2016 that number fell by 26 percent, meaning that only 58 percent of all app users were on iOS devices. Android usage rose by 91 percent, with 42 percent of the use share of all apps.
- In 2015, 42 percent of users accessed apps through a tablet. In 2016, that number fell to 12 percent.
- Android users spend, on average, 8 minutes 8 seconds per app session versus the 5 minutes 29 seconds that the average iOS user spends per session. However, iOS users generally view more screens per session with 7.82 versus the 7.04 screens per session of an Android user. Although the usership of the iPad has fallen, their remaining users still spend 7 minutes 57 seconds on average per session.
- The most popular app type of 2016 was events (30.3 percent), and by some distance. Sales support apps (15.7 percent) lead the rest of the pack ahead of portal apps (11.2 percent) and internal communication apps (9 percent).
- 34.1 percent of all apps created in 2016 were by companies in the professional services sector, followed by energy and utilities, technology, retail and media (all at 9.8 percent).
- Professional services built 17.14 apps per business in 2016. They were followed by the healthcare (15.50 apps per business) and tech (15.50 apps per business) industries.
ContractIQ, meanwhile, also started out its report with an observation about increasing demand for enterprise mobile apps, from the outsourcing/contractor perspective: "For the third year in a row, enterprise demand for custom app development has increased from 23 percent in 2014 to 29 percent in 2015 to 32 percent in 2016."
 [Click on image for larger view.]
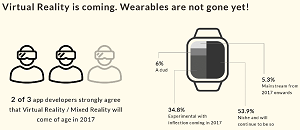
Virtual Reality and Wearables (source: ContractIQ)
[Click on image for larger view.]
Virtual Reality and Wearables (source: ContractIQ)
Furthermore, the company said, those enterprise apps are now returning more ROI.
"When compared to 2015, when only 30 percent of the businesses that built apps had revenue goals for their app businesses, in 2016 that percentage jumped to 60 percent," the company said. "That's a 100 percent increase in revenue generation as a goal for new apps. Across the board, companies of various sizes and maturity invest in mobile to generate a new revenue or increase of existing businesses. We are finally seeing mobile investments that are measured by financial outcomes."
 [Click on image for larger view.]
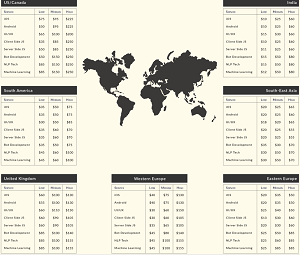
Global App Development Pricing Comparison (source: ContractIQ)
[Click on image for larger view.]
Global App Development Pricing Comparison (source: ContractIQ)
Other highlights of the ContractIQ report include:
- Only about 50 percent of app development agencies believe that custom app development on native programming languages will dominate their revenue.
- About 30 percent of agencies believe that platform- and SDK-driven app development will dominate, as enterprises start spending on development of apps for internal use.
- Close to 20 percent of app developers see customers choosing to build bots, instead of apps, in 2017, about 12 percent think bots will be bigger than apps, but only 3 percent believe bots are app-killers.
- 2 of 3 app developers strongly agree that virtual reality/mixed reality will come of age in 2017.
- Almost 54 percent believe wearables are niche market and will continue to be so, while 34.8 percent believe wearables are experimental, with inflection coming this year.
- Only 8 percent of app developers believe that we are beyond the "peak of apps," while 20 percent are unsure. That leaves more than 70 percent of developers who still believe that custom app development will continue to grow.
- Organizations of all sizes are comfortable strategizing about their mobile roadmaps, with 44.2 percent of app development agency customers saying they understand mobile, 30.1 percent saying it's a commodity with vendors chosen by pricing, and 25.7 saying they need guidance.
The report also provided pricing information, detailing what mobile development companies charge per hour in different regions around the globe. High-end machine learning development averages $250 per hour in the United States and Canada region, for example, while the same thing costs $70 in Southeast Asia. Most respondents think pricing will remain the same, with only 14.8 percent believing prices will come down.
To find out more about the increasing demand for enterprise app development, see these previous related articles:
About the Author
David Ramel is an editor and writer at Converge 360.