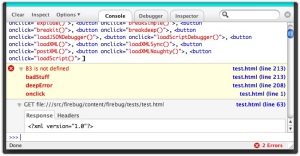
Alert-Free Ajax Debugging
- By Matt Stephens
- June 28, 2006

Anyone developing web applications in the “old days” (pre-2003 or thereabouts) would be all too familiar with the JavaScript alert() function; it’s traditionally been much (over-)used for debugging purposes, to get some sort of clue as to what’s going on at run-time in the browser DOM, or in the JavaScript code itself.
Poor debugging tools has always been something of an Achilles’ heel for JavaScript. The situation is improving with better IDE support, but getting a feel for the live state of a web page, including its request parameters, response header fields and so forth, has always been rather tricky.
Anyone developing an Ajax web application (e.g. using the popular Prototype.js library that I blogged about the other day) will know that the need for web debugging tools is even greater now.
Luckily, the tools are beginning to catch up. One tool that stands out from the crowd is FireBug, an add-on for Firefox.
FireBug lets you explore the far corners of the DOM, and monitor your JavaScript, CSS, HTML models in memory. All sorts of inspectors allow you to examine elements, styles, events and so forth. You can also log all AJAX request traffic as it happens, and inspect the responses.
I like this quote from FireBug’s website: “Web developers have suffered with "alert debugging" for centuries. If you enjoy clicking the "Ok" button 40,000 times a day, FireBug is not for you.”