News
IBM Opens Up Node.js App Metrics Tool
- By David Ramel
- May 26, 2016
The Node Application Metrics monitoring and profiling agent from IBM is now fully available with an open source license, according to the company's developerWorks Open site. Previously the tool -- also called "appmetrics" -- was available as a hybrid project with some parts open source but with core monitoring capabilities kept in-house.
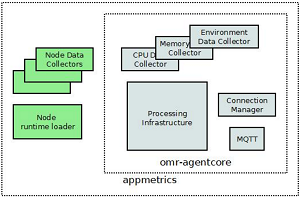
That last bit has been opened up as omr-agentcore, now available on GitHub.
"The omr-agentcore project provides the core monitoring framework that underpins our runtime monitoring solutions," IBM's Toby Corbin wrote in a blog post yesterday. "It handles the monitoring processing, for example, triggering collection of data from a runtime or passing that data onto a network socket. The omr-agentcore project governs the flow of data from a runtime to an endpoint."
Corbin went on to explain the "omr" part of the new product's name.
"The Eclipse OMR project provides a highly integrated set of open source C and C++ components that can be used to build robust language runtimes," he said. "We are working closely with the Eclipse OMR team to use as many of their key features as possible. As an integrated component, we provide core monitoring capabilities for any runtime built on Eclipse OMR technology."
According to the project's GitHub site, "Node Application Metrics provides a foundational infrastructure for collecting resource and performance monitoring data for Node.js-based applications."
 [Click on image for larger view.]
Node Application Metrics (source: IBM)
[Click on image for larger view.]
Node Application Metrics (source: IBM)
Specifically, it provides built-in data collection sources via APIs such as: machine and runtime environment information; process and system CPU; process and system memory usage; HTTP request calls made of the application; WebSocket data sent and received by the application and much more.
That functionality is apparently in high demand, as IBM said in February that the tool was being downloaded more than 20,000 times per month.
The tool borrows some of that functionality from IBM's Health Center developer tool, one of the offerings under the company's Eclipse-based IBM Monitoring and Diagnostics Tools. Developers using the new tool have the option of accessing monitored data through an API or visualizing the data with the Eclipse IDE by using the Health Center client.
"Node Application Metrics exposes JavaScript and C APIs, which makes data collection available to developer tools, management and scaling utilities, and performance monitoring tools, such as StatsD with Graphite or Elasticsearch with Kibana," says the project's developerWorks Open site.
That site provides open source stats (140 stars, 12 contributors, 26 forks) and information on community contributions. Under a heading of "Why should I contribute?" IBM said: "Analyzing and viewing the behavior and activity of an application requires the ability to identify and measure the component parts of the application and how these parts interact. With the rich ecosystem of diverse components and modules that are available to Node.js applications, Node Application Metrics lets you ensure that visibility and insight are possible for everything from the most popular packages to those niche but important modules that solve very specific problems."
About the Author
David Ramel is an editor and writer at Converge 360.