News
Logi Analytics Updates Self-Service BI Tool
- By David Ramel
- July 22, 2015
Logi Analytics Inc. updated its self-service business intelligence (BI) analytics offering, adding new tools and updating existing components.
The company aims to provide BI analytics to the enterprise masses, obviating the need to go through developers or IT staff to glean business insights from accumulated data. According to a company survey last year, 93 percent of respondents agreed that's an important goal, but only 22 percent had that capability.
To help attain that self-service capability, Logi 12 was announced after a two-year development effort, providing customization that goes beyond the "one-size-fits-all" approach, the company said in a blog post yesterday.
That customization caters to three distinct groups of BI users with different analytical needs identified by the company: consumers, who prefer pre-configured dashboards and reports; creators, who select predetermined data and create new report for sharing; and analysts, who use their own data, discover their own insights and share them.
"Many tools focus on a single, technical end user," the company said. "With 12, we're thinking through how everyone, from the least technical consumer to the skilled analyst, is trying to make data-driven decisions."
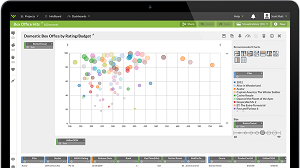
 [Click on image for larger view.]
Visualizing Data with Logi Vision (source: Logi Analytics Inc.)
Aiming to help guide such decisions, Logi 12 introduces new functionality in the form of the Logi DataHub, for data preparation. "With DataHub, customers can rapidly connect, acquire and blend data from files, applications or databases, whether on-premise or in the cloud; cache it in a high-performance self-tuning repository; and prepare it using DataHub's smart profiling, joining, and intuitive data enrichment," the company said in a news release.
"Logi DataHub includes connection to databases, including HP Vertica, SQL Server, Oracle, PostgreSQL, MySQL, ODBC, and OLEDB; cloud applications including Salesforce.com, Marketo, Eloqua, HubSpot, NetSuite, MS Dynamics, Quickbooks, Freshbooks, Google Analytics, Twitter, Facebook and OData, as well as Excel and CSV files," Logi said.
The company also updated its Logi Info tool, a business analytics tool for creating analytics apps, deploying dashboards and reports and embedding analytics into existing applications. "Logi Info now includes new interactive visualizations, self-service dashboard authoring and real-time charts," the company said. "Updates include faster application development, integration with GIT and TF, and 2x to 10x faster performance."
For further visual explorations, the Discover Module is an add-on for Logi Info, with "an intuitive end user interface, including chart recommendations that help business users quickly understand data and discover insights more quickly in a self-directed environment."
Also related to data visualizations, the company's Logi Vision component sports a new data visualization recommendation engine that improves itself with usage and new project templates with prepopulated data connections, visualizations and dashboards.
"Many vendors in the BI market focus on a single type of user," the company quoted analyst John L Myers of Enterprise Management Associates as saying. "This leaves IT departments to assemble a patchwork of disparate solutions to meet multiple user needs. By addressing multiple user requirements, Logi positions itself to improve adoption of analytics and empowers all levels of an organization, regardless of their skill set, to make data-driven decisions."
About the Author
David Ramel is an editor and writer at Converge 360.